The Map Was the Easy Part
How we built Alkira's cloud region explorer around a maintainable data workflow, not just a Google Maps interface.
- API Design
- Data Architecture
- Google Maps
- Google Sheets
- Interactive Applications
Interactive, data-driven apps seem easy to build these days. Especially with AI. Give a model a prompt, get back some markers on a map, add a couple of filters, and you’re most of the way to a convincing demo.
The demo isn’t the hard part. Keeping the thing accurate, useful, and maintainable six months later is.
We ran into exactly this distinction while building an interactive cloud infrastructure map for Alkira, a company working in multicloud networking. The public-facing requirement was straightforward: help visitors explore global cloud regions, compare providers, and understand the geographic footprint relevant to Alkira’s network.
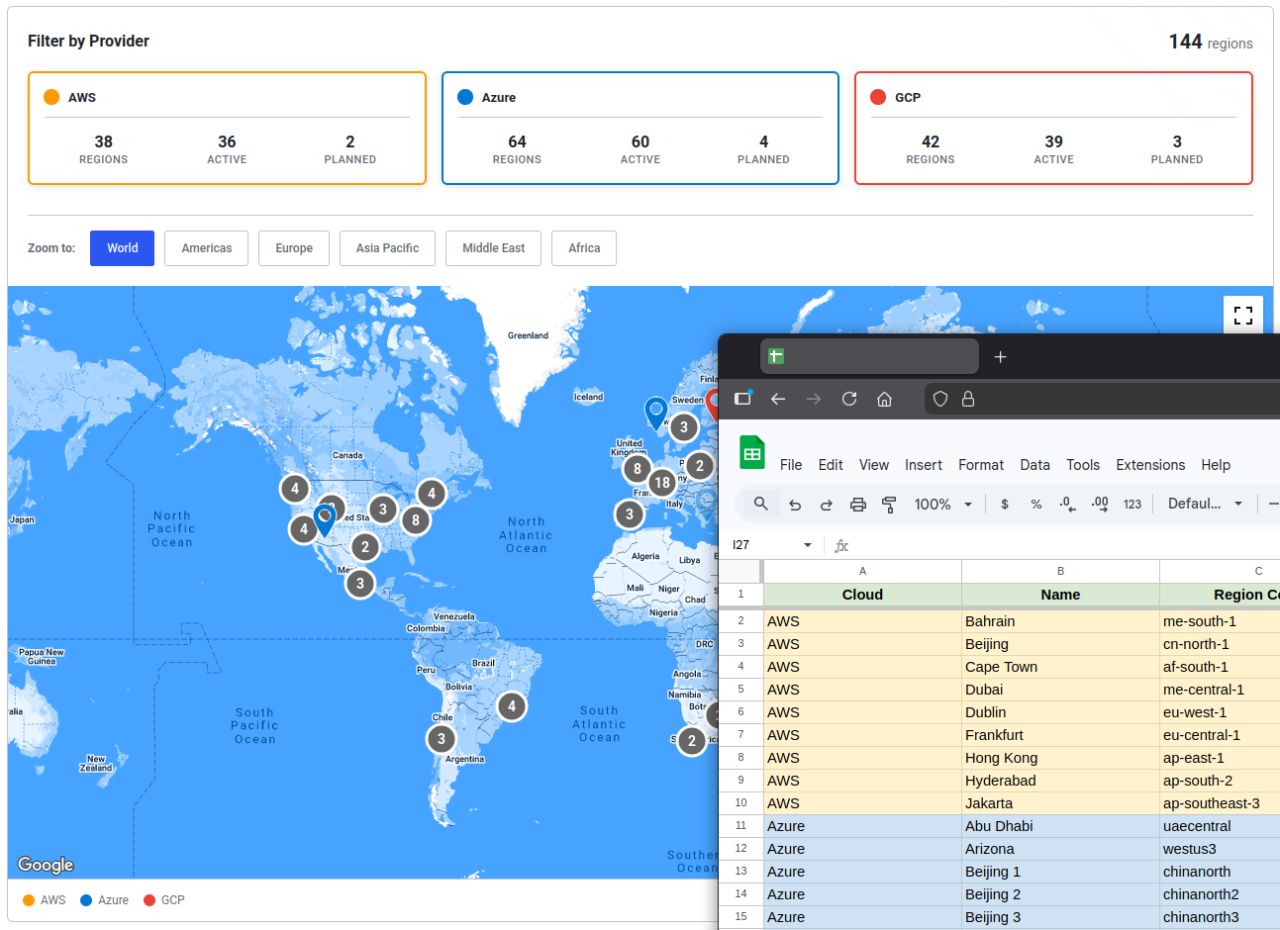
On screen, it looks like a fairly conventional map. There are markers, clusters, provider filters, region counts, and popups. None of that is especially exotic.
The interesting part is everything you can’t see.
A map isn’t a content management system
Before this, the team was relying on third-party resources to visualize provider coverage. Those tools were useful, but they weren’t necessarily current, tailored to the business, or under Alkira’s control.
The natural response to that sort of requirement is to rebuild everything inside the website’s CMS. Create a custom content type for regions, add a bunch of fields, wire up a map component, and call it a day.
That can work. It can also leave you with a maintenance problem disguised as a successful launch.
Cloud infrastructure data is not the same as ordinary marketing content. Regions come online. New locations are announced. Providers use different naming conventions. Operational teams need accuracy; marketing teams need a predictable way to publish that information without opening a development ticket every time something changes.
Those are different responsibilities, and forcing them all into one editing interface doesn’t automatically make them easier.
The requirement wasn’t simply build a map. It was build a resource the client could operate.
Separate the data from the page
Rather than make the map the center of the system, we split the work into four distinct layers:
| Layer | Responsibility | Implementation |
|---|---|---|
| Authoring | Let non-technical staff maintain region and provider information | Google Sheets |
| Ingestion | Validate, normalize, and import the data predictably | Custom ingestion process |
| Access | Serve a consistent dataset without exposing the editing workflow | Read-only REST API |
| Presentation | Help visitors explore the data | Google Maps frontend |
That division was the architectural decision that mattered most.
Google Sheets as the authoring interface
A spreadsheet isn’t glamorous, but it was a good fit. The team already understood rows, columns, and tabular data. We didn’t need to invent an admin interface to solve a problem Google Sheets already solved well.
Each location could be maintained with its associated provider and region metadata. The spreadsheet became the place where the team managed the information, not a second application they had to learn.
The key is that Google Sheets is the authoring layer, not the public API. The browser doesn’t need direct access to a spreadsheet, and the spreadsheet doesn’t need to know anything about Google Maps markers.
A familiar editing tool can be a better administrative interface than a custom dashboard. The important part is establishing a reliable boundary between editable source data and the data your application consumes.
Ingestion is where the guardrails live
Data maintained by humans needs to be treated as input, not as unquestionable application state.
We built an ingestion layer to validate the expected schema and normalize the records into a consistent structure. The process was idempotent, so rerunning an import wouldn’t create a new set of duplicate locations simply because the same source data had been processed again.
This separation also means the rendering code doesn’t have to compensate for every difference in how a provider names or structures a location. The data gets cleaned up before it reaches the map.
The goal wasn’t elaborate data engineering for its own sake. It was to make updates boring and predictable.
A spreadsheet makes a system easy to edit; it doesn’t automatically make it trustworthy. Schema validation, normalization, and repeatable ingestion are what turn editable rows into dependable application data.
Give the frontend a read-only contract
Once the data was normalized, we exposed it through a read-only REST API.
That kept the frontend independent of the authoring workflow. The map didn’t need to know who edited the sheet, how the import ran, or how the source data had been organized. It just received a consistent, flat record for each location.
A flat, per-location dataset is particularly useful for this kind of interface. Instead of asking the browser to navigate a complicated hierarchy just to answer which regions belong to this provider?, the data is already arranged around the thing being displayed.
It also keeps the CMS from becoming the point of coordination for every concern. The page can change without redefining the dataset, and the data can change without rebuilding the page.
Let the map do map things
With the data model settled, we could keep the interface focused on presentation and exploration.
We used Google Maps for the familiar interactions and added the behavior the resource actually needed:
- Provider and group toggles with counts that respond to the selected data.
- Marker clustering so dense geographic areas remain navigable.
- Region details in popups rather than cramming everything into a marker label.
- URL-backed filter state so a particular view can be shared or revisited.
- Regional zoom controls to move quickly between global and local views.
That last bit of URL-backed state is easy to underestimate. An interactive map becomes considerably more useful when someone can send a colleague a specific filtered view instead of saying, “Open this page, turn off two providers, and zoom into Europe.”
Clustering matters for the same reason. You can have good data and still deliver a terrible interface if dozens of markers pile up on top of one another. The map needs to help people navigate the dataset, not merely prove it exists.
You can explore Alkira’s public cloud provider map to see the resulting interaction.
The real deliverable was the operating model
The most important outcome wasn’t that we could plot AWS, Azure, and Google Cloud regions on a map. Plenty of products can do that.
It was that Alkira could maintain its own customer-facing resource without making ordinary data updates an engineering project.
Marketing had a familiar place to manage the data. The ingestion process enforced a consistent structure. The API gave the frontend a predictable contract. And the interface stayed focused on making that information explorable.
As the underlying infrastructure changes, the content can change with it. Updating a location isn’t supposed to mean editing JavaScript, rebuilding a page, or redeploying the site.
That division of responsibilities also reduces the temptation to bolt more and more administration features onto the map itself. When a system has clear boundaries, each part can remain relatively small.
From the Alkira team, Bob Long, Senior Manager of Brand and Creative Services, put the result this way:
Our sales team needed a stable resource page to help visualize Alkira’s reach. Michael and his team provided a great solution. It has the features we needed with a simple-to-maintain back end. This is now one of our most highly-viewed pages.
That last point is the one I care about. The page wasn’t just shipped; people are actually using it.
Why this matters even more with AI
AI has made it easier than ever to produce convincing interfaces. A map with markers, filters, and a polished layout is no longer a particularly difficult prototype.
But AI doesn’t remove the need to decide who owns the data, how it’s validated, what happens when it changes, and which parts of the system are allowed to depend on which other parts.
Those decisions determine whether the application is still useful after the launch excitement wears off.
It’s tempting to judge interactive work by what appears on screen. In practice, the interface is often the easiest part to replace. The harder—and more valuable—work is designing an operating model that the client can actually live with.
That’s what made this project successful. The map was the easy part.